Progress Indicators
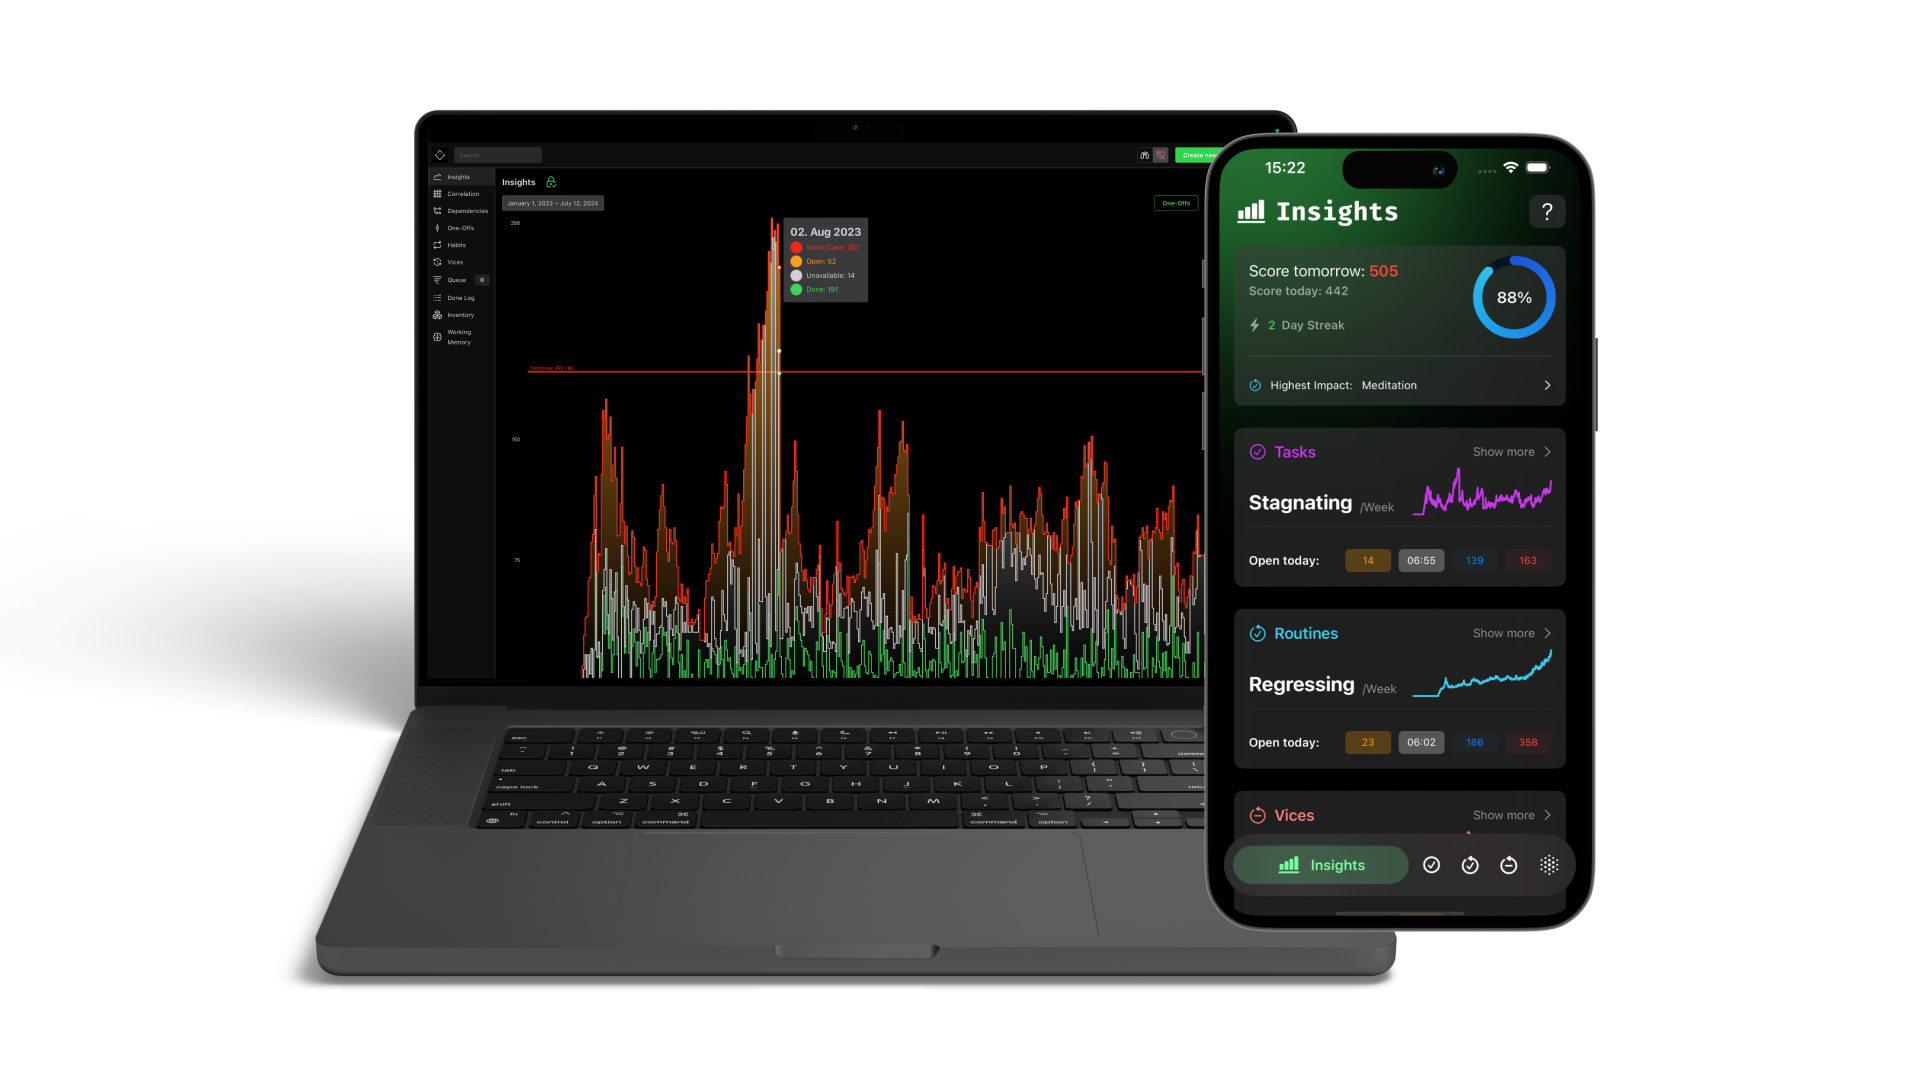
When you go tho the Insights tab you will see an overall graph that displays your Score over the selected timeframe.
Score
When you create a Task or Routine you also give it an Importance Level. The Score is then calculated by multiplying the Importance of it with the number of days it hasn’t been done (Inflammation). So for example a Task with an Importance of 5 that has been open for 3 days will have a Score of 15.
In the graph you can see a horizontal line that shows Tomorrow: 351 (49). It shows you the Score you will have tomorrow based on the current state of your completed Tasks, Routines and failed Vices.
The number in the () shows you how much Score you need to purge until you achieve a green Score for tomorrow.
You goal should be to have a lower Score tomorrow than you have today. If this is achieved, the line will turn green.
In the graph you can see your Score development over time. Each day since you started using Svayy is represented. By hovering over a day in the graph you will see the actual Score in each category.
By default the graph shows a summary of Tasks, Routines and Vices. You can disable or enable each of them in the top right corner:
- Red = Not shown in the graph
- Green = Shown in the graph